My game runs pretty aweful atm so i had a profiler run.
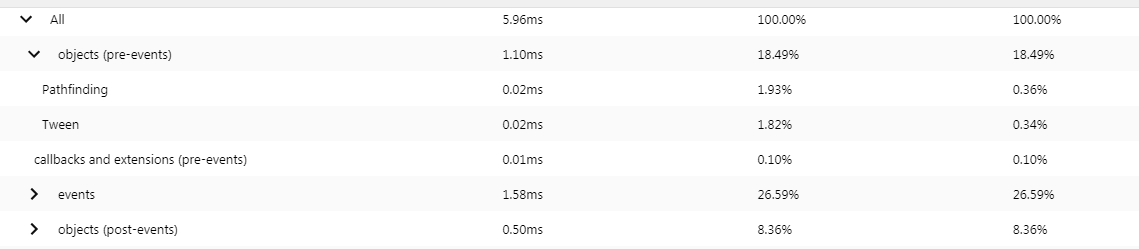
My question now is, what falls under the category Objects - pre-events?
I try to figure out why this number is so high.
I can imagine its because i have quite alot of tansparency objects, but isnt that supposed to fall under Render?
From the wiki:
Objects (pre-events) - The time spent running behaviors before the events
http://wiki.compilgames.net/doku.php/gdevelop5/interface/debugger/profile-your-game#profile_your_game
that does not help me, what behaviors?
according the the profiler all behaviors i use (pathfinding and tween), use less then a percent of obects pre-events ![]()
I guess my question is more about what your perceived performance issues are. 6ms is only about 1/3rd of a frame at 60fps.
ok, it seems just the lack of a graphic card. 800x600res was working, 1920x1080 not.
but when i look at the actual numbers of the profiler, even with everything enabled it takes about 10ms.
but id like to know anyway what the bulk of the preevents is made of, cause it does not look like it is my behaviors. maybe the behavior have quite some overhead, and even when not active/used cost/count towards preevents?
I don’t know exactly what the pre-events are, but I can verify I’ve had similar experience with behaviors. They made my project run much slower (it’s a somewhat resource intensive project). I even removed the “destroy when off screen behavior” from a few objects; the behavior is simple to mimic with a few events. The benefit of using events is they can be loaded on demand using conditions/external events, although it’s some additional work to set it up.
Perhaps this would be a good suggestion as a feature request? The ability to activate/deactive behaviors depending on conditions?
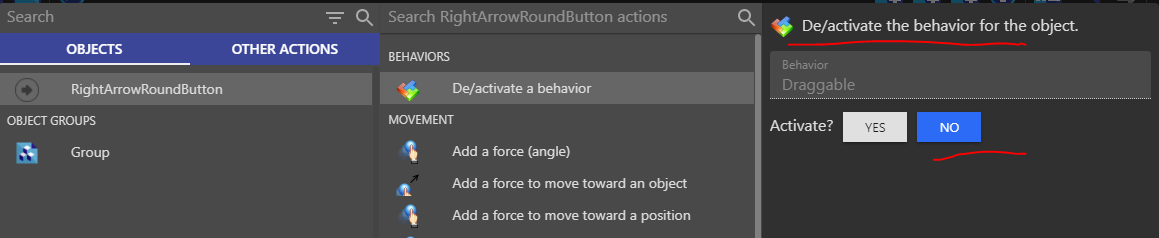
It isn’t the first time I’ve suggested something that was already implemented, and probably won’t be the last.
Thank you for assisting in my education ![]()
1 Like
I’m not sure why the percentages don’t add up, maybe they’re per instance? ![]()
I haven’t used the performance profiler much.
in that example i have only 1 single object with those behaviors. so that cant be it.
I wish understand the callstack of one frame, this should be write somewhere ^^
The profiler is pretty tiny for now, as far i know the callstack for Objects (pre-event) section is:
1 - Positions
2 - Update the instance (animation, color, text, …, stuff setup in the object properties basically)
3 - Forces
4 - Behaviors
I hope I didn’t talk nonsense, that’s what I understood from the codebase.
1 Like
Thank you bouh
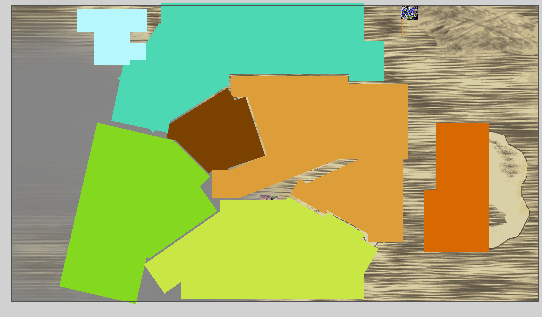
I have lots of objects that are ask if cursor is in collusion to change color
So that would explain!
Ooh, that could actually cause performance problems depending on your object selection (conditions) and how you have it set up.
Could you show an example of your event?
Does “At the beginning of the scene” events count as pre-events?
It doesn’t, it’s in the event sheet so it counts as in events, not before or after.
1 Like
Thank you so much ![]()
not very efficient:

E: i did change the non-trigger once collusion checks as a subevent of left click.
like so:
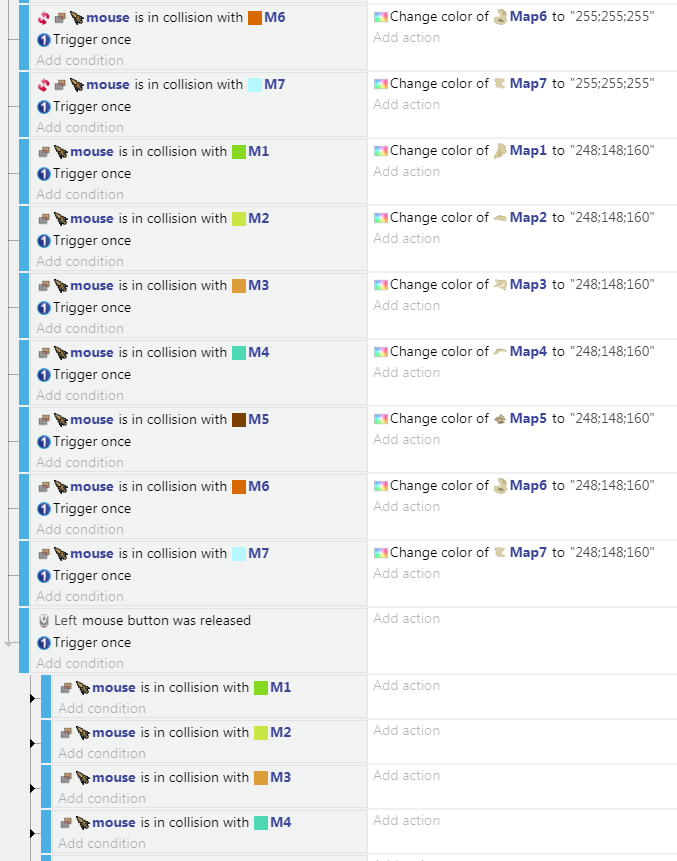
34 map triggers: (there are lots more, but the variable land / province keeps the counts smaller)
i was thinking maybe i make variables to store the cursor position and then check the collision only if the position changes. or maybe chack distance to the maps first.